
RUSSET – RUSSIAN SOCIO-ECONOMIC TRANSITION PANEL
Longitudinal survey of changes in objective and subjective indicators of living conditions in Russian during the transition time (1993-1999)
The RUSSET Panel (Russian socio-economic transition panel) is a unique dataset of longitudinal data to track changes in objective and subjective indicators of standard of living and quality of life in 1990s and to conduct methodological experiments on measurement quality using MTMM and split-ballot design.
The study was conducted annually from 1993 till 1999 – during the whole period of the most radical changes in the life of Russian society after the break up of Soviet Union. In this time Russia represented the huge natural social laboratory allowing to study the impact of global social changes and transformations on daily life, practices, behavior, aspirations and attitudes of people. It was unique and rare chance for social scientists to witness such global social process developing in very high speed rather than spending decades of observations and experiments.
The data collection was done by face-to-face interviews PAPI mode in respondent’s homes on probability random sample of Russian population 18 years old and over drawn in 1993 and then included in each round of the survey till 1999. The initial sample size was 3700 respondents.
IDEA OF THE SURVEY
The idea of the survey came from the joint research work of V.G. Andreenkov and W. Saris in International MTMM group and their discussion of methods to study social change.
Most social changes in developed countries of Europe North America happen gradually and slowly compared to life of researchers. Significant shift in social environment, behavior or public attitudes can be traced only after many years or decades of measurement. Radical macro-level changes in political system, economic relations and social structure experienced by Russia in 1990-s created to be unique conditions for researchers to study the impact of changes in objective living conditions and subjective evaluations in relatively short time span, observe the life of people in “high speed mode” as in a movie. Russia serves as a social science laboratory where many experimental research methods and techniques could be applied and checked. In this lucky times for social scientists teams of researchers from Netherlands (Willem Saris, Annette Scherpenzeel, Bernard van Praag, Peter Vriyters, William van der Velt) and Russia (V.G. Andreenkov, A.V. Andreenkova, A.E. Bronnikova, A.V. Fedotov, I.A. Chuslyaeva) took joint efforts to organize the RUSSET. This project was also joined by leading scholars from other European countries interested in this area of research (Jack Billiet, Belgium, Peter Schmidt, Germany, Dagmar Krebs, Germany, Germa Goenders, Spain).
The project was supported by the Dutch Organization for scientific research (NWO) for conducting seven rounds of this panel study.
THEORETICAL AND METHODOLOGICAL BACKGROUND
The main idea of the project was to study the impact of socio-economic changes on the change in subjective evaluations of life as a whole (satisfaction with life) and different life domains.
The survey also intended to check several hypothesis about the relations of the satisfaction with life and objective living condition and hypothesis about the reasons of change in life satisfaction.
Along with measuring current status (objective living conditions in particular domain) and subjective evaluation (level of satisfaction with a domain) retrospective information on the same parameters was collected for 1988, 5 years prior to the first round of the survey, before major socio-economic reforms). It helped to understand the relationship between objective and subjective indicators and the likelihood of change in stable socio-economic conditions and in time of major social transformations.
Theoretical model used to study social change in RUSSET:
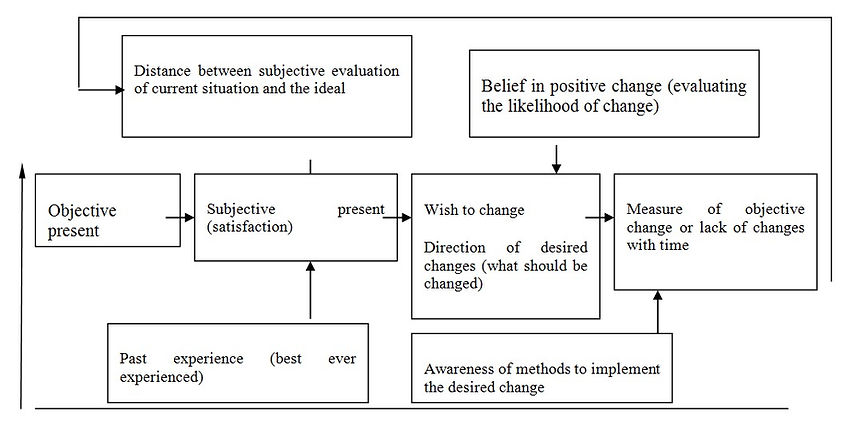
Another purpose of the project was to understand change in subjective evaluation with life and its domain. For each life domain current level of satisfaction with life was measured, the wish to change the situation, clear view on the direction of change, what should be changed, readiness to take efforts to achieve changes and the confidence that the change can be achieved. We followed the 'need fulfillment theory' or 'the discrepancy theory' which suggests that people get satisfied by fulfillment of their needs or the reduction of the discrepancy between their wishes and the reality (Diener, 1984), but added an action component suggesting that people being unsatisfied with the present situation might try to take action to improve it if they see the specific domain of life as important enough to act [Frijda’s theory of emotions, 1984]. The action component includes the possibility of individual as well as collective action. If no change in living conditions happened, one still can expect changes in the evaluation of the situation - adaptation of the aspirations to the realistically possible options [LaBarbera and Mazursky, 1983, Michalos, 1985 and Saris, 1996].
The survey was also designed to check the hypothesis that the level of satisfaction with life as a whole and particular life domains is influenced by the comparisons – with other people (reference group), with ideal (expectations), with the best past experience (retrospective comparison), and with average others (perceived social norm) and perceived level of need and deserved (Andrew and Withey, 1976; Campbell, Converse and Rogers, 1976; Harvey and Smith, 1977).
METHODOLOGY
RUSSET is a panel survey where the same people were interviewed after particular time interval again. First round of the survey was conducted in 1993 and then interviewers come back to the same people every year seven times till 1999. The sampling design and the fieldwork have been done by the Institute for Comparative Social Research (CESSI, project manager was the senior researcher Dr. Anna Andreenkova).
RUSSET includes two panels. Initial panel was based on the sample of respondents drawn in 1993 and finished in 1999. Because of sample attrition after several rounds substantial part of respondents were lost because of different reasons – migration, deaths, change of health status, refusals. To recover the sample to initial sample size and also to compare parameters between “old” and “new panel” new samples were drawn in 1997 (round 5) on the same sample principles and module as initial sample. Two latest round of the survey (round 6 and round 7) were conducted with both old and new panel.
Each survey round was administered by face-to-face interviews in respondent’s homes. About 200-300 interviewers participated in each round, about 34-45% changed between modules and the rest was the same across rounds.
SAMPLE
The sample design for baseline of the survey was done on multistage probability area sample model. Population parameters were estimated according to government statistical information – Goskomstat prediction data for January 1 1992 based on National Census 1989 and sample parameters closely resemble the state statistical data on key socio-demographic and geographic indicators: urbanization, ethnicity, age, gender, education and some others.
The universe covered the entire population aged 18 and over living permanently in Russian territory. Military bases, penal communities, and other institutionalized population were excluded from the sample. No other exclusions have been done.
Sample stages:
-
Stratification of the country into 4 regions combining all socioeconomic zones as used by National Statistical agency. The selection within each region was conducted independently, the number of selected units was proportionate to the population of each region.
-
Stage 1. The primary sampling units (PSU) - rayons (counties) or cities with rayon status were listed in each of 4 strata (region) from largest to smallest by population size. In each strata PSUs were selected proportionate to population size. Total number of PSUs was 52 units including 8 self-representing units in 2 cities with population size larger than average size of PSU (selection probability=1).
-
Stage 2. Selection of SSUs (settlements – cities, towns, villages) within each PSU with probability proportional to population size. In total 125 units were selected.
-
Stage 3. Selection of electoral districts within each settlement with equal probability.
-
Stage 4. Selection of households. Pre-selection enumeration of households in selected TSUs in larger cities, centralized selection of households (addresses) using random computer procedures. In smaller places and rural areas the selection of households were done during the field by random route method. Each household in the sample was visited at least 3 times to increase the cooperation rate. Visits were planned for different days of the week and for different times of the day.
-
Stage 5. Random selection of respondent within a household using Kish random tables method.
SAMPLE IMPLEMENTATION
The sample included all respondents from Round 1 regardless of the results from previous round. The level of cooperation in Round 1 was 76%. In Round 2 the sample decreased by 25%, then to 14% in round 3 and to 2% in round 4. After seven years in the last round of the survey 43% of initial respondents stayed in the sample.
To compensate this sample attrition, new panel was constructed in 1997. As regional and socio-demographic profile of respondents were similar regardless of the attrition (taking into account the natural move of age groups), new sample was drawn as independent national sample using the same design as initial one.
Table 1. Survey parameters by rounds
Rounds
Year
Total
Panel 1
Panel 2
Time of interviews
Round 1
1993
3727
3727
Round 2
1994
2808
2808
Round 3
1995
2273
2273
Round 4
1996
2074
2074
July-September 1993
May-June 1994
June-August 1995
March-April 1997
Round 5
1997
2218
2218
Round 6
1998
3513
2002
1511
Round 7
1999
2868
1618
1250
November-December 1997
October-December 1998
November-December 1999
CONTENT, SURVEY QUESTIONS
The questionnaire contains stable core questions asked in the same form for all rounds of the survey (trend questions). Life domains included in the survey: family life, housing conditions, employment, household finances, social contacts, health. For each life domain the survey included: (1) parameters describing objective present situation in first round and description of changes in each domain in further rounds 2) satisfaction with the present situation, (3) intention to take action to change the situation.
Along with studying substantial issues, the project included many methodological experiments on the perception of answer scales with different characteristics – type of scale, number of scale points, balanced and non-balanced, verbal, graphical and digital, different context, order of answers, middle category, different ways of treatment missing information.
Several rounds of MTMM (multi-trait-multi-method design) experiments were conducted to study reliability and validity of different questions and scales, in particular questions on satisfaction with life and its domains, ethnocentrism, political anomie – the unique information collected in Russia for the first time. In Round 1 and 2 these methodological experiments included multi-trait multi-method panel experiments, in which groups of questions were repeated within the same round (test-retest). In Rounds 3 and 4 the sample was randomly divided into three subgroups, each subgroup was given a different subset of questions at the end of the questionnaire that were also asked at the beginning of the questionnaire (to all groups). In Rounds 5, 6, and 7 multi-trait multi-method and split ballot experiments were also executed. In these rounds two random samples, named A and B, were used as subgroups for the experiments.
SATISFACTION OR HAPPINESS? From the article of A. Andreenkova, W. Saris
more >>